
What Do <RL and µ Mean?! Tips for Interpreting Your Lab Data
November, 2021 – Whether you’ve just had your own drinking water tested, or have a job that requires lab testing for wastewater, soil, or suspect building materials, we know that deciphering the environmental lab report to see if the results indicate a problem can sometimes be, well, a problem.
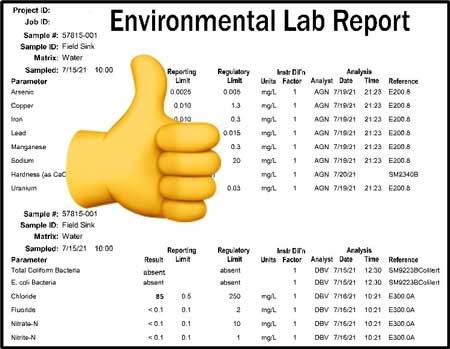
When you receive results from the lab for the first time, you might expect to open it and get quick answers. In fact, it would be great to see a big thumbs up emoji indicating all is well.

But alas, you will probably find that the lab report seems to be written in hieroglyphics, with strange acronyms, odd units of measure, fine print, and disclaimers.
Environmental laboratory reports are detailed and complex for sure, but there are good reasons for the complexity; environmental labs must undergo rigorous processes in order to remain current with all state, federal and industry-specific regulations, guidelines, standards, and testing methods.
While there is admittedly a lot of information contained in a lab report, we know that deciphering what your data means is the most important part of the process. Here we will go through a typical lab report row by row, column by column and acronym by acronym, to help you better understand your results.
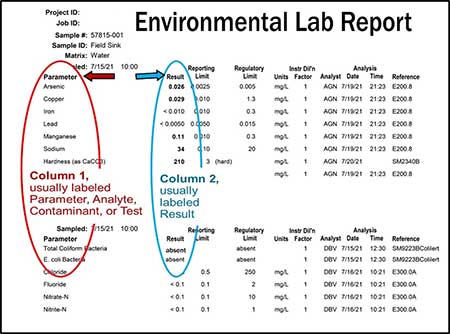
Column #1: What was tested
The first column on most environmental lab reports will contain a list of the analytes you requested on your Chain of Custody form. The column header used here may vary; common headers for this column include Parameter, Analyte, Contaminant, or Test. These are the contaminants the laboratory has tested, per your request.
Column #2: Your results
The second column on most environmental lab reports will contain your results, or the amount of the contaminant found in your sample. This is usually a number (sometimes preceded by a “<” symbol, which we’ll discuss in the Reporting Limit section).
Don’t Panic, yet
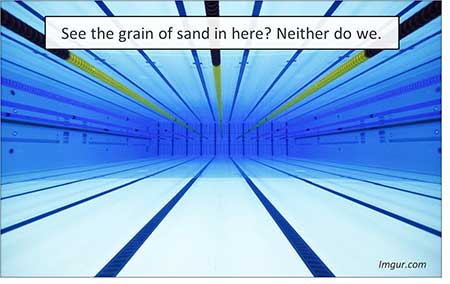
It may be helpful to remember that a certified environmental lab is able to detect contaminants in a sample at exceptionally low limits, i.e., in parts per million and parts per trillion. An analogy often used is that one part per trillion (ppt) is akin to finding one grain of sand in an Olympic-size swimming pool.
That being said, if your results show that a substance was detected in your sample, this does not necessarily mean that you have a problem with ‘contamination.’ Some substances are not harmful, while others have acceptable limits, as determined by the EPA and/or your state environmental services department. This is called the Regulatory Limit or MCL.
Regulatory Limit
The Regulatory Limit, or Maximum Contaminant Level (MCL), is a legally established maximum allowed amount of a contaminant in drinking water. These limits are set by the EPA and/or a state agency to protect human health.
Now Compare Result to MCL
In order to see if the detected amount exceeds allowable limits, you next will want to compare the Results number to the Regulatory Limit / MCL (see below). When the substance tested is detected at a level which exceeds these regulatory levels, which are established as health guidelines, you will want to take action to resolve the contamination issue. (Some labs will use Satisfactory/Unsatisfactory or some similar notation instead of an MCL).

So What’s the ‘Reporting Limit’?
The ‘Reporting Limit’ column lists the lowest concentration measurable by the analytical method. A lab report will often use < (less than) followed by the Reporting Limit number in your Results Column (see above), when the chemical is not detected in the testing process.
Every instrument has a limitation for how low of a concentration it can detect, so a lab cannot say there is “zero” present. Simply put, “<RL” means that the amount of the chemical agent is below the sensitivity of the test.
If your lab results show a number that is above the Reporting Limit, but below the Regulatory Limit, that simply means that the analyte was detected, but it does not exceed the established legal limit set to protect human health, and no action is required at this time.

However, depending on which analyte is found below the MCL and how much is present, in some cases you should consider retesting more often or even consider investing in a water treatment system. For example, people often opt to treat their water for arsenic even when it is found at levels less than the established 0.005mg/L limit.
Peripheral Columns of Note
ANALYSIS METHOD
The EPA issues industry-wide analytical methods (test procedures) for the analysis of environmental samples. Laboratories must be certified for the analyte, technology, and/or matrix you are requesting. This column will usually be labeled something like Analysis Method, Procedure, or Reference.
UNITS
This column shows the unit of measure used by the lab. Your results will usually be reported in one of the following units. (To convert ppm to ppb, multiply by 1000)
mg/L = ppm = parts per million
ug/L = ppb = parts per billion
ng/L = ppt = parts per trillion
DATE, TIME, ANALYST
These columns are self-explanatory, listing when the analysis occurred and the name or initials of the chemist.
OTHER TERMS
Since each laboratory will have their own reporting styles, you may also see some of the following terms on your lab report. These are EPA and industry recognized terms that have been established for clarity in lab reporting.
Surrogate Recovery
The compounds listed under “Surrogate Recovery” are compounds added to your sample as part of the lab’s Quality Control procedures. These are not compounds detected in your sample, they are listed per laboratory protocol. Surrogate recoveries that fall outside established acceptance ranges may indicate a problem with the process or something about the sample which caused an interference, which is very unusual in a drinking water sample. This process is just one part of a thorough Quality Control system.
Dilution Factor
Because of the sensitivity of the equipment, sometimes the lab will need to dilute a sample with high purity water prior to analysis to get an accurate measurement. This factor has already been applied to the value shown in the Result column.
Qualifiers
Some labs use “qualifiers” to note problems or irregularities that may have occurred during the analysis. Since precision is paramount in lab reporting, chemists will use these industry-recognized notations to provide additional information on their report. Some common qualifiers you may find on your lab report include “U” “H” and “J”:
- U qualifier (for example, 0.18 U) means that compound was not detected (undetected) at that level.
- H qualifier means the sample did not meet the referenced method’s holding time. The holding time is the maximum amount of time allowed, from collection to analysis, in which accurate results can be expected for that parameter. The holding time is like an expiration date for your sample.
- J qualifier (for example, 1.8 J) means that compound was detected, but at a level too low to be confident in the amount. Because it is detected at such a low concentration, the reported result is an estimate.
Want to Know More?
Homeowners who are testing their water quality might find the following websites very useful:
Understanding Your Well Water Test Results. This video from the State of Maine CDC, while produced for Maine residents, is pertinent and useful to most, with a great visual explanation on interpreting a lab report
NHDES Be Well Informed Guide. NH Department of Environmental Services (NHDES) has created a tool for interpreting your Drinking Water lab data, as well as tips for beginning the remediation process.
As mentioned earlier, lab report formatting will vary from lab to lab, but most environmental lab reports will contain the following information:
Contaminant– what is being tested
Result– how much of the contaminant was detected
Reporting Limit– lowest detectable concentration
MCL or Regulatory Limit– maximum allowable amount of a contaminant
Result Qualifier– any irregularities of note
Unit of Measure– parts per trillion, milligrams per liter, etc.
Method– the EPA approved testing procedure used in the analysis
Because laboratories, by nature, are driven by the combined complexities of things like regulation, certification, scientific protocol, quality control and data precision, the information contained on a lab report is necessarily complex. If you are looking for a quick “thumbs up or thumbs down” answer to your contamination question, you can often follow these simple steps when looking at your lab report:
- Find your result (RESULT column)
- Compare it to health guidelines (MCL column)
- If it’s below, you should be good to go.
If your results number is above an acceptable limit (MCL), your state’s environmental services division can provide more information on risk factors pertinent to your geographical location, testing and remediation options and more.
This page from the Environmental Protection Agency (EPA) provides links to all of the Health and Environmental Agencies in the U.S. These agencies are well versed in answering questions from concerned citizens, business owners, environmental engineers, and municipalities about environmental contamination. Good luck!